

The app
Everything in one place
The app runs in the browser — on a phone at the track, on a tablet in the gym or on a laptop in the office. Nothing to install.
App features
The core features included with the app.
Live timing
Split times and speeds appear as the athlete runs through the timing units. The app warns you if a timing unit stops working.
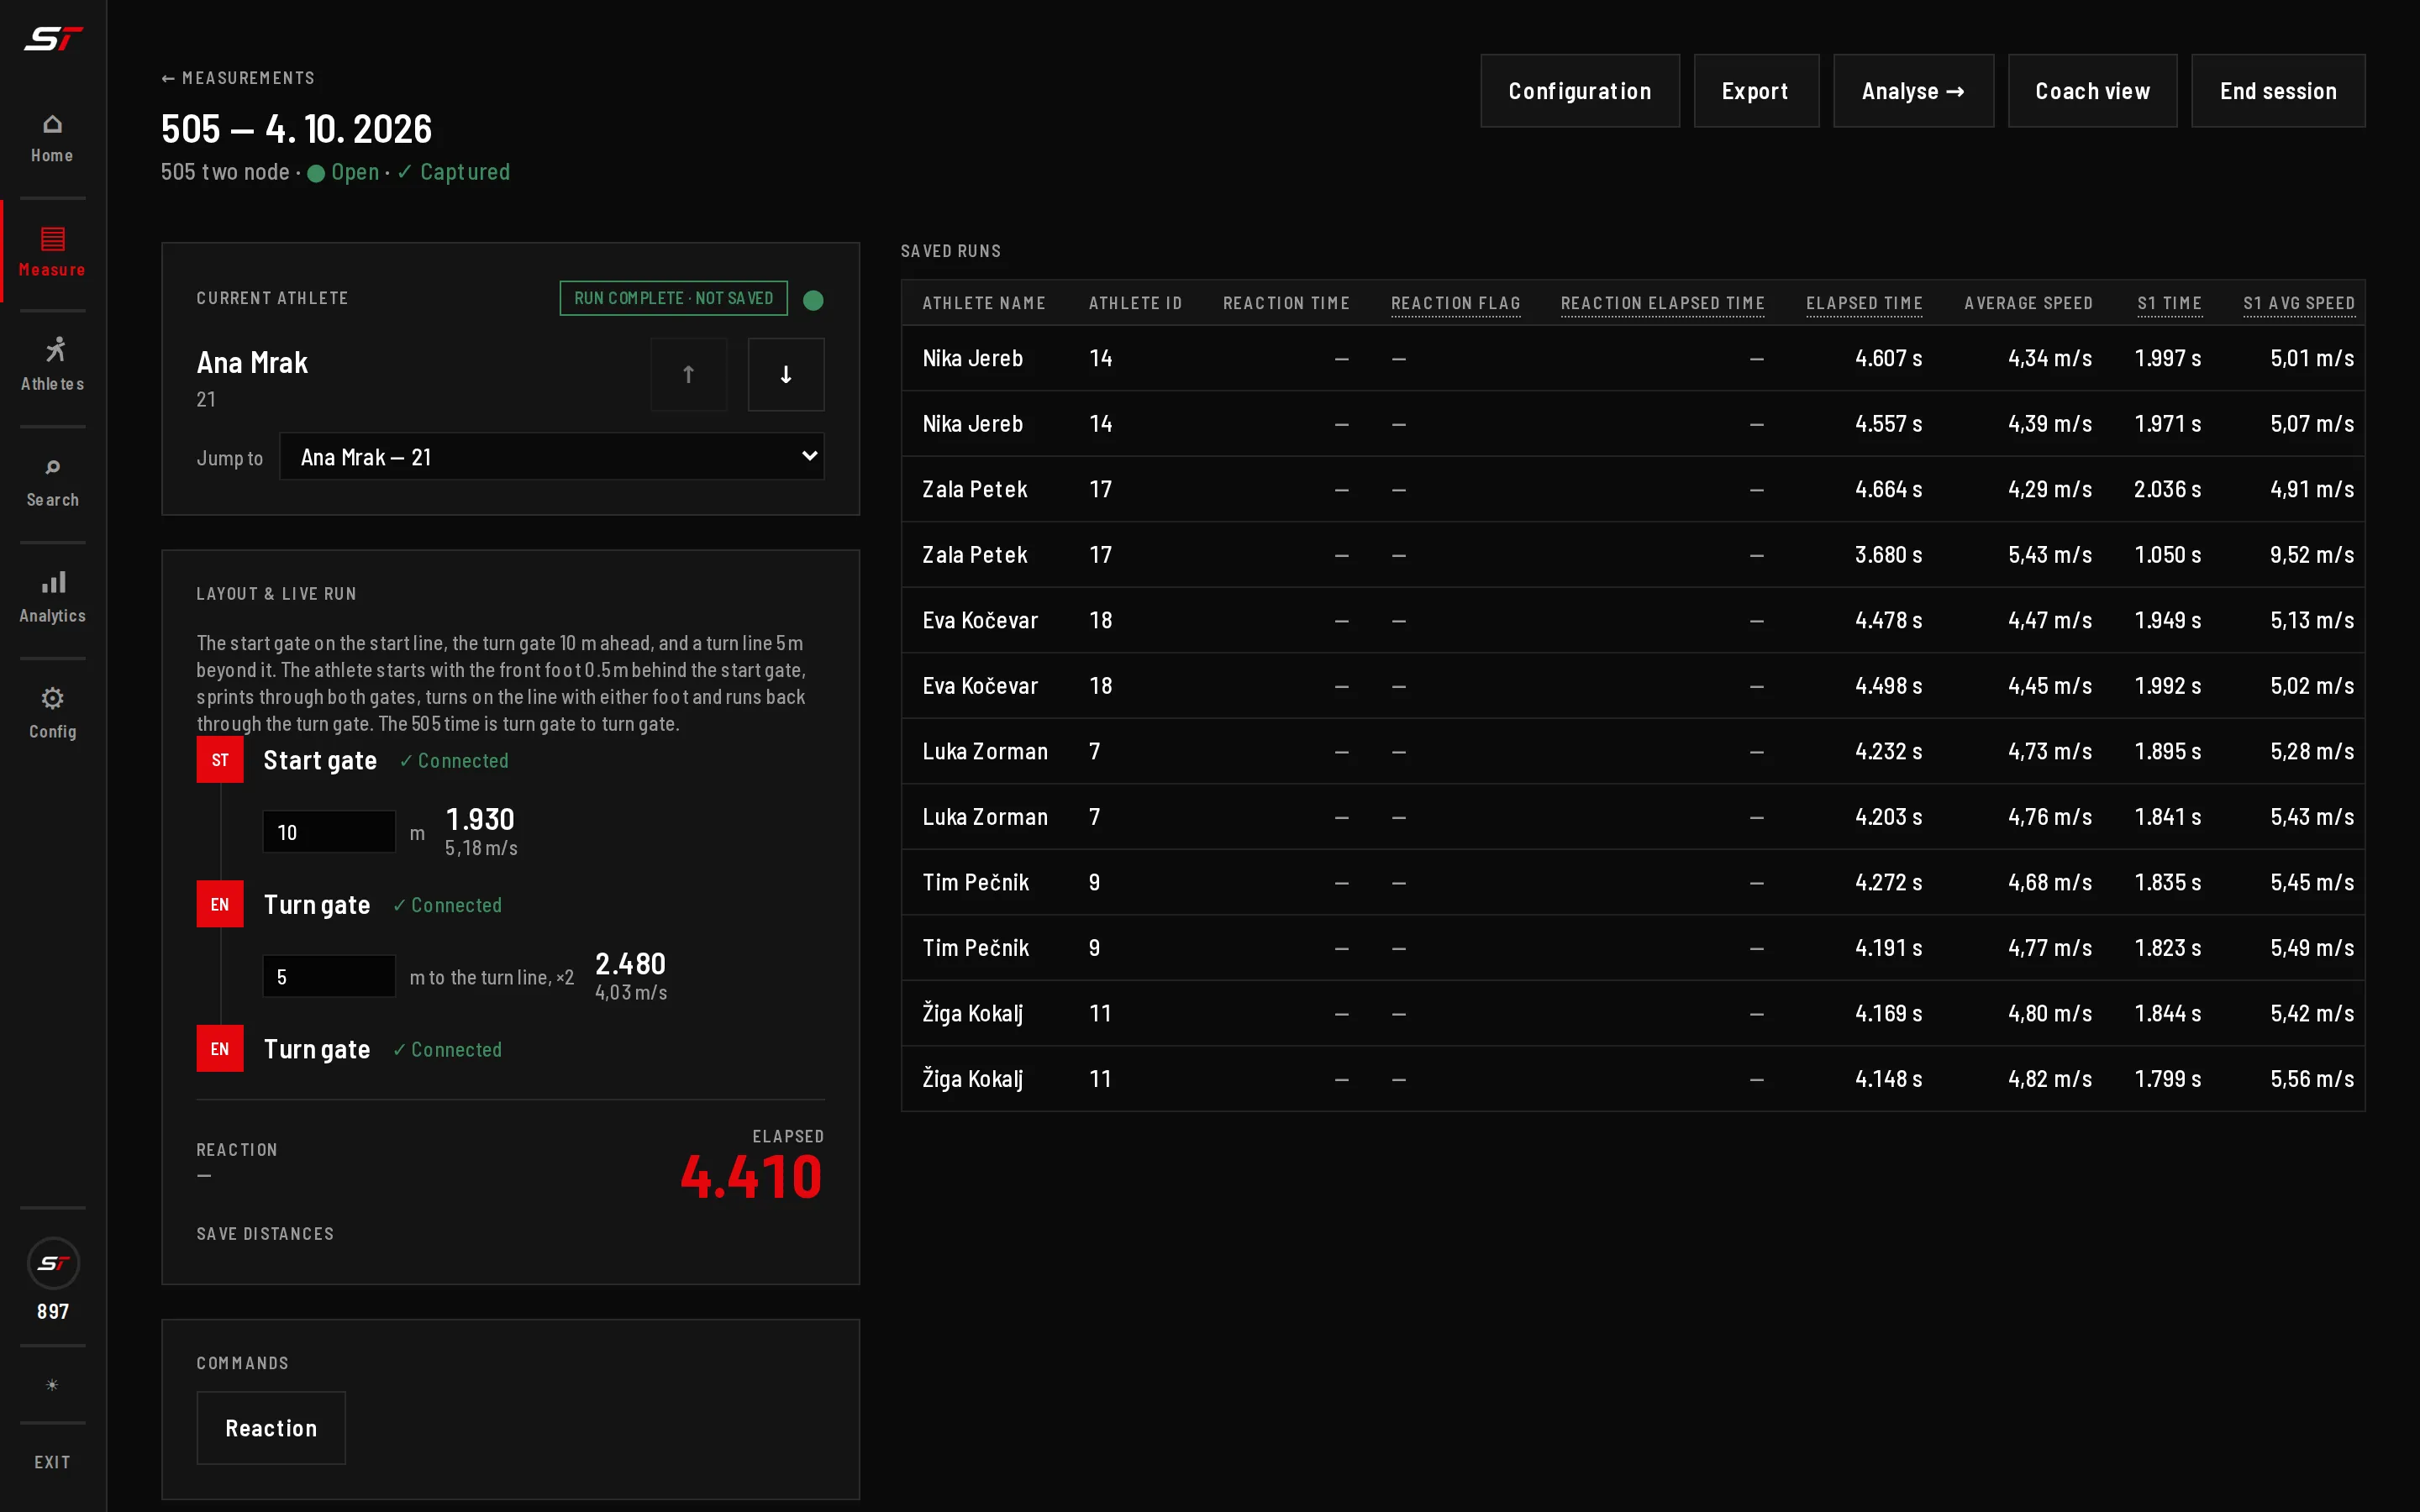
A 505 run live, just before the coach saves it.
Simultaneous measurements
Several coaches, each with their own account, can run different tests at the same time on separate timing units — say a 5-10-5 on one timing unit and a 505 on two others. An athlete can do two different tests one after the other, which speeds up testing considerably.
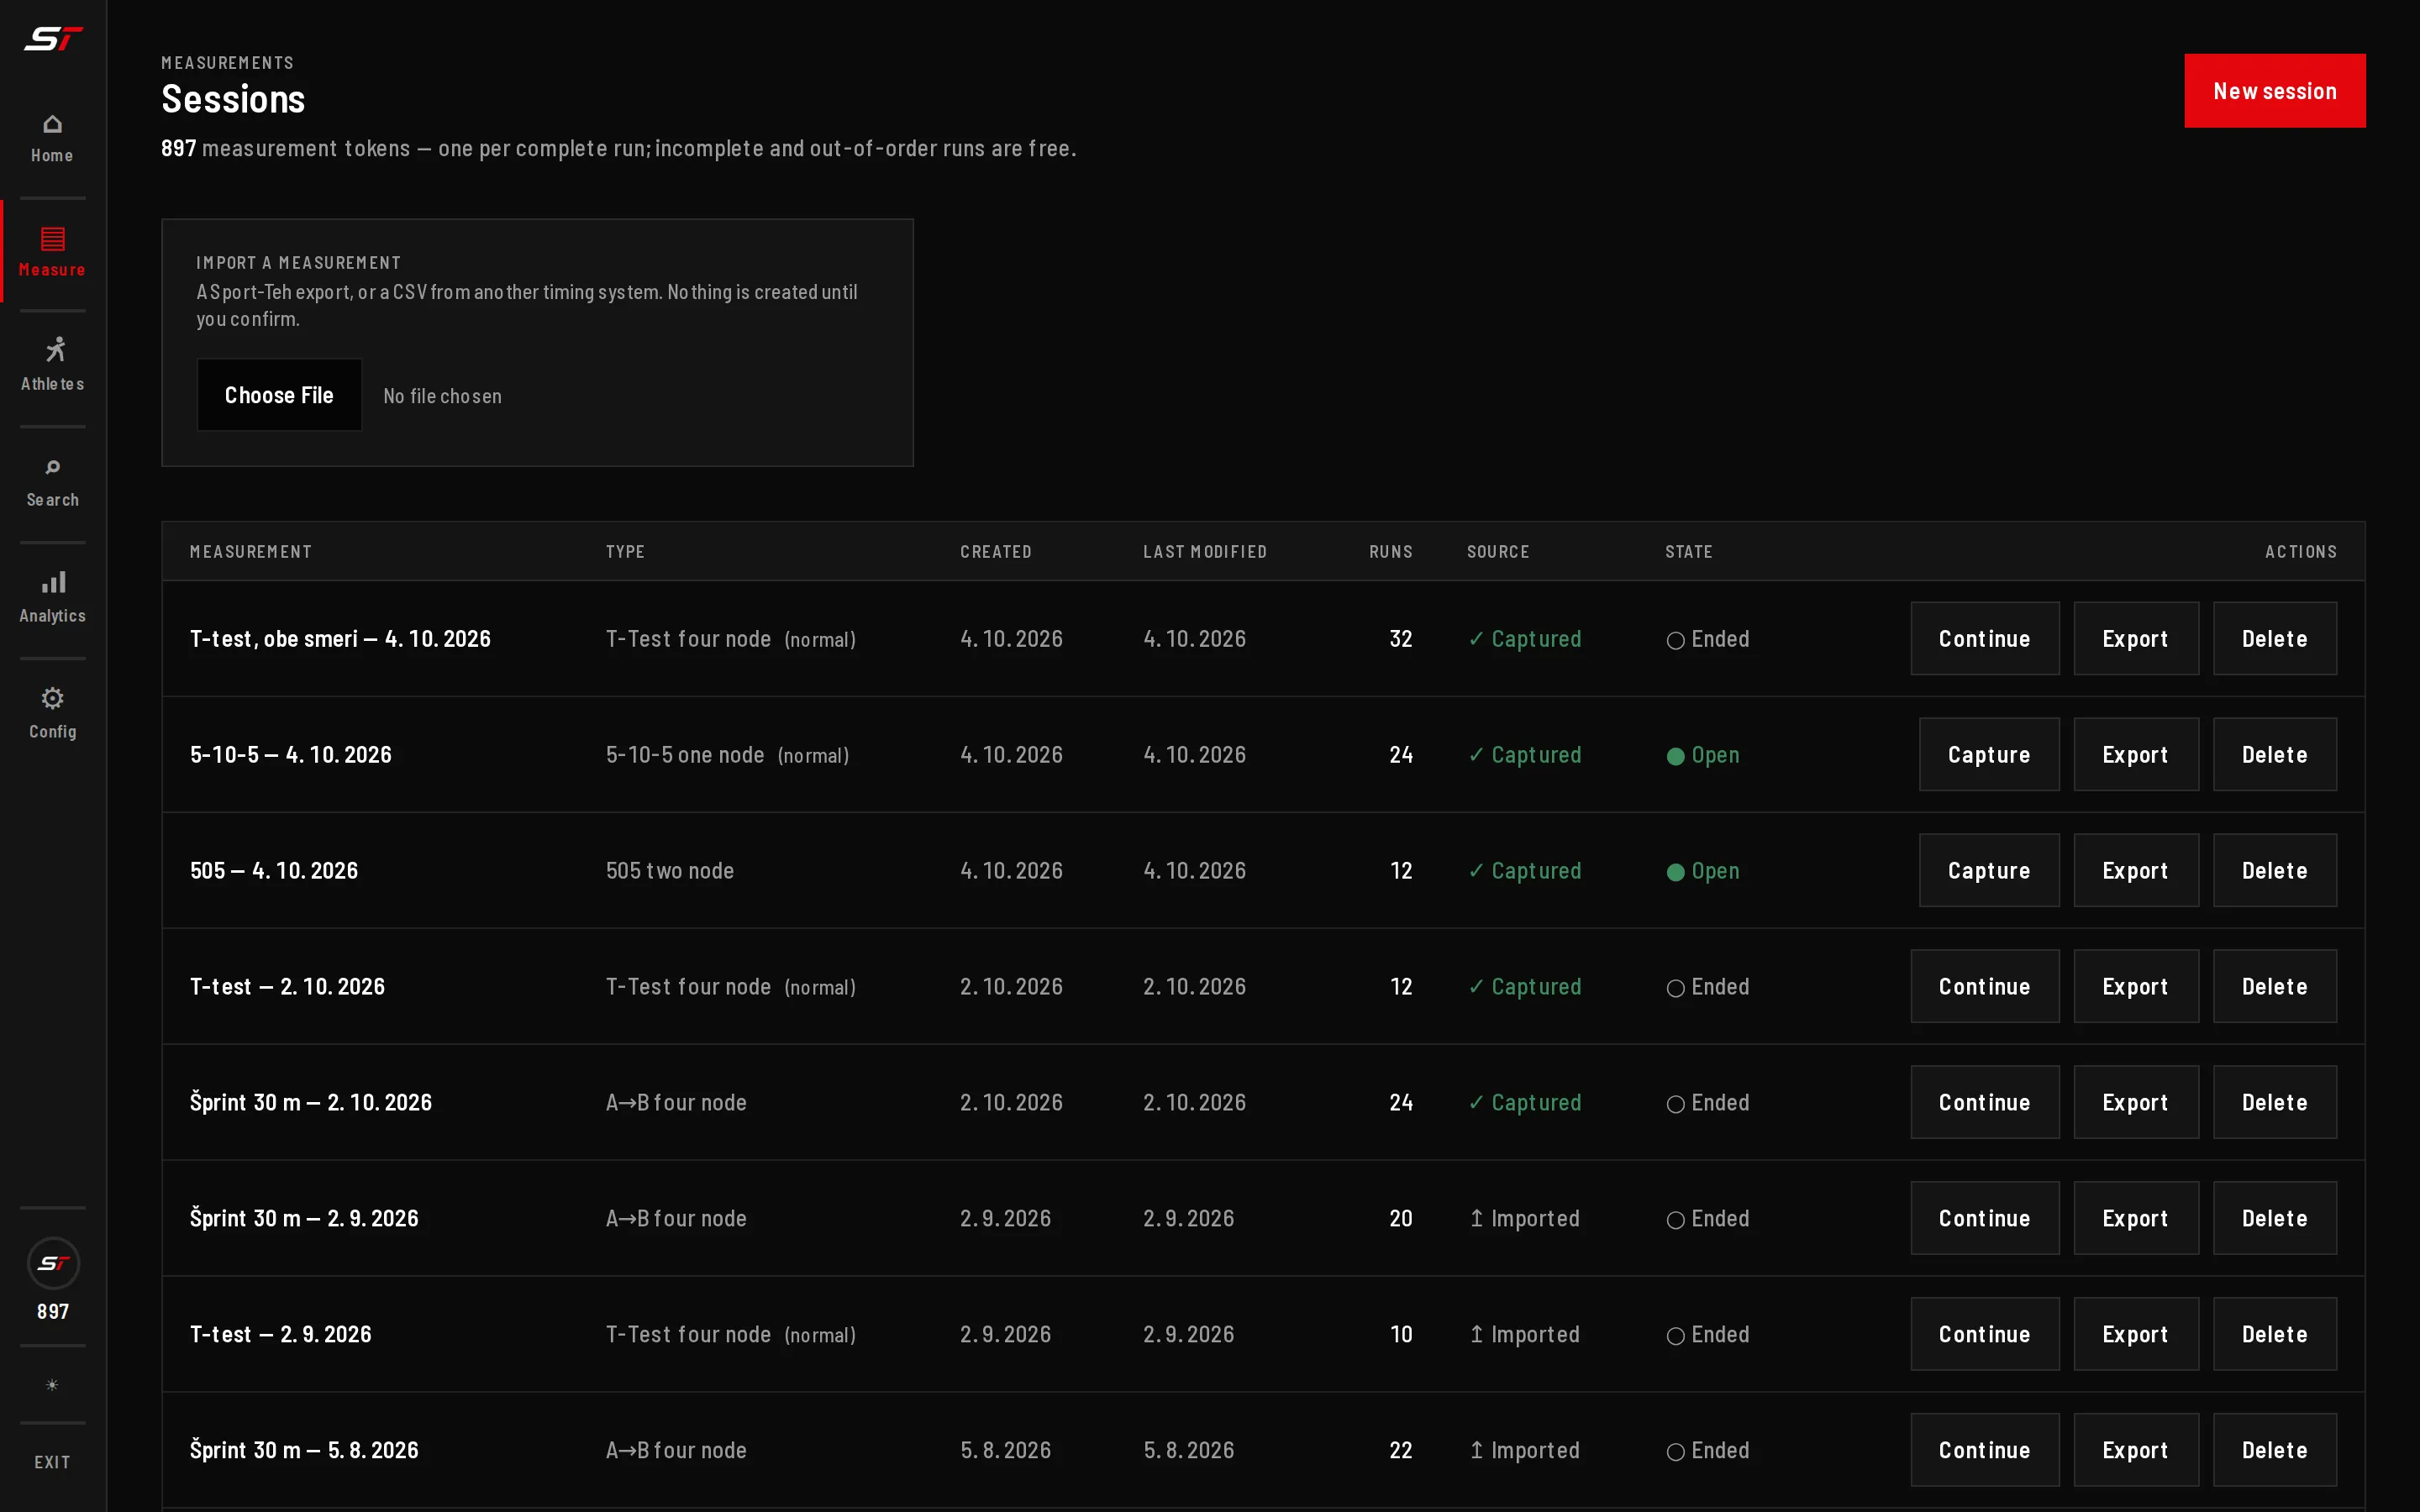
The sessions list: a 5-10-5 and a 505 open at the same time, each run by its own coach.
Athletes
Add athletes one at a time or as a whole team. Year of birth and gender are optional, but recommended for comparisons and analytics within age groups.
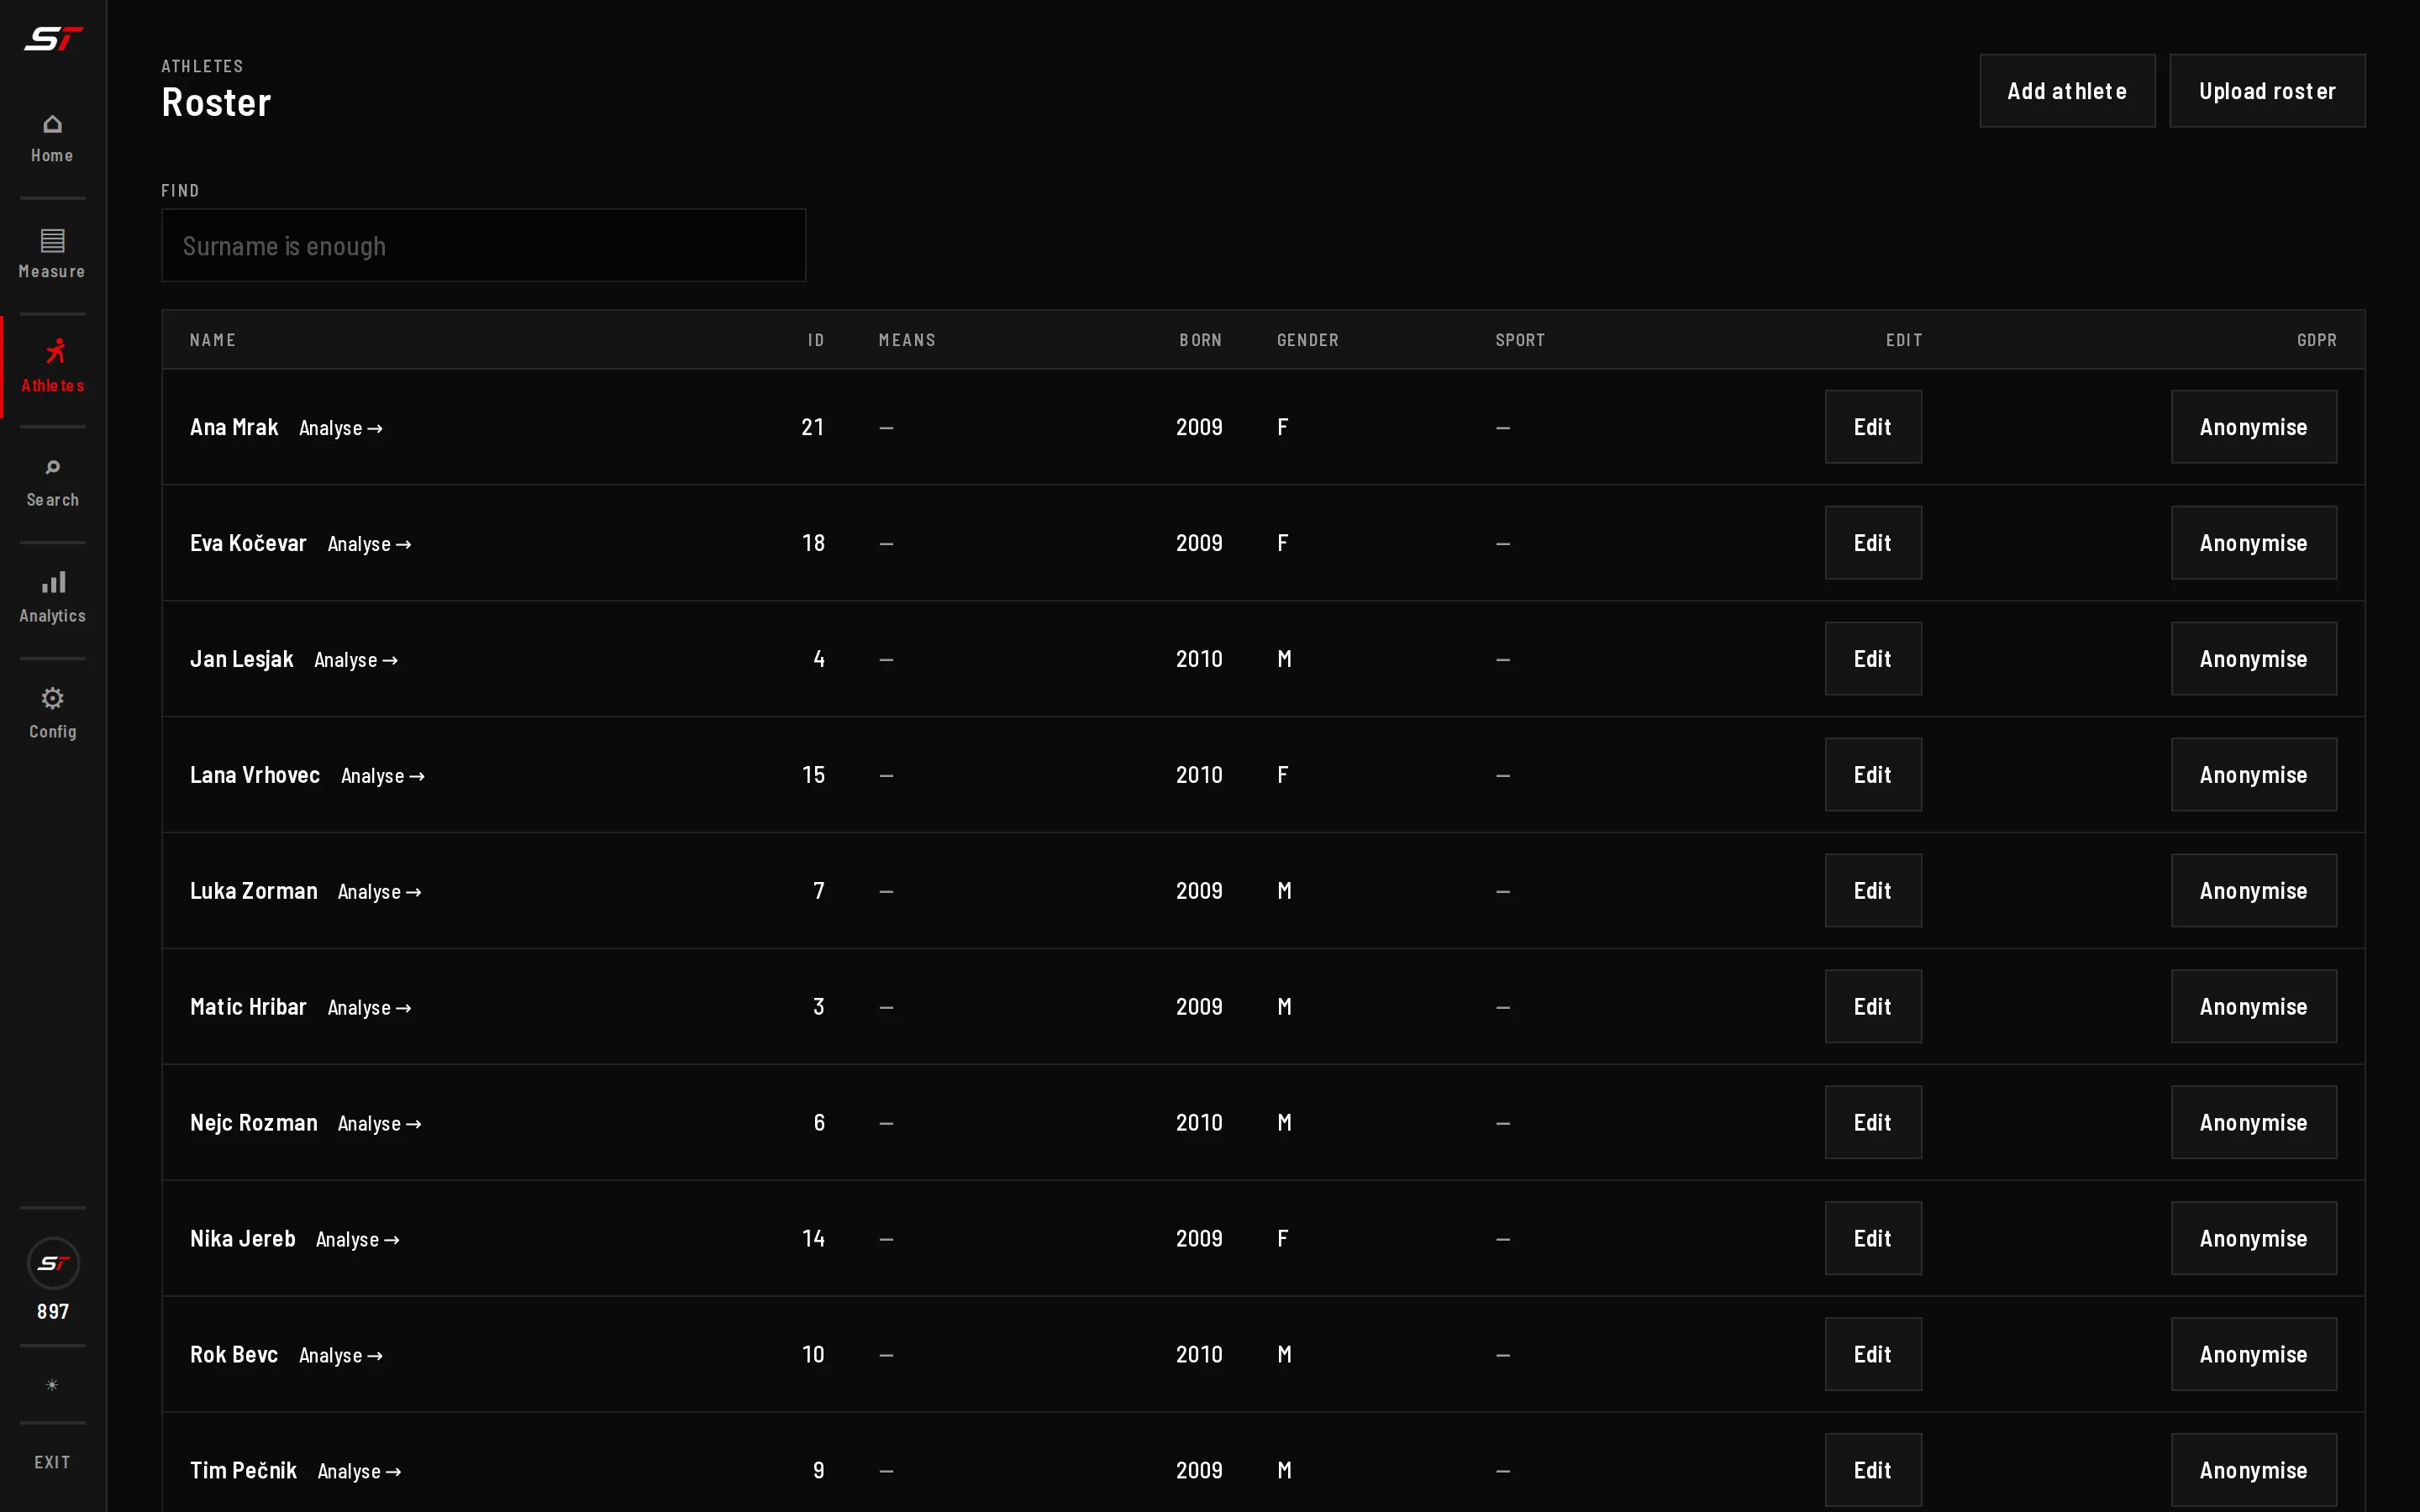
The roster, with year of birth and gender.
Results and export
A clear table for every session, CSV export, and the option to re-import CSV files.
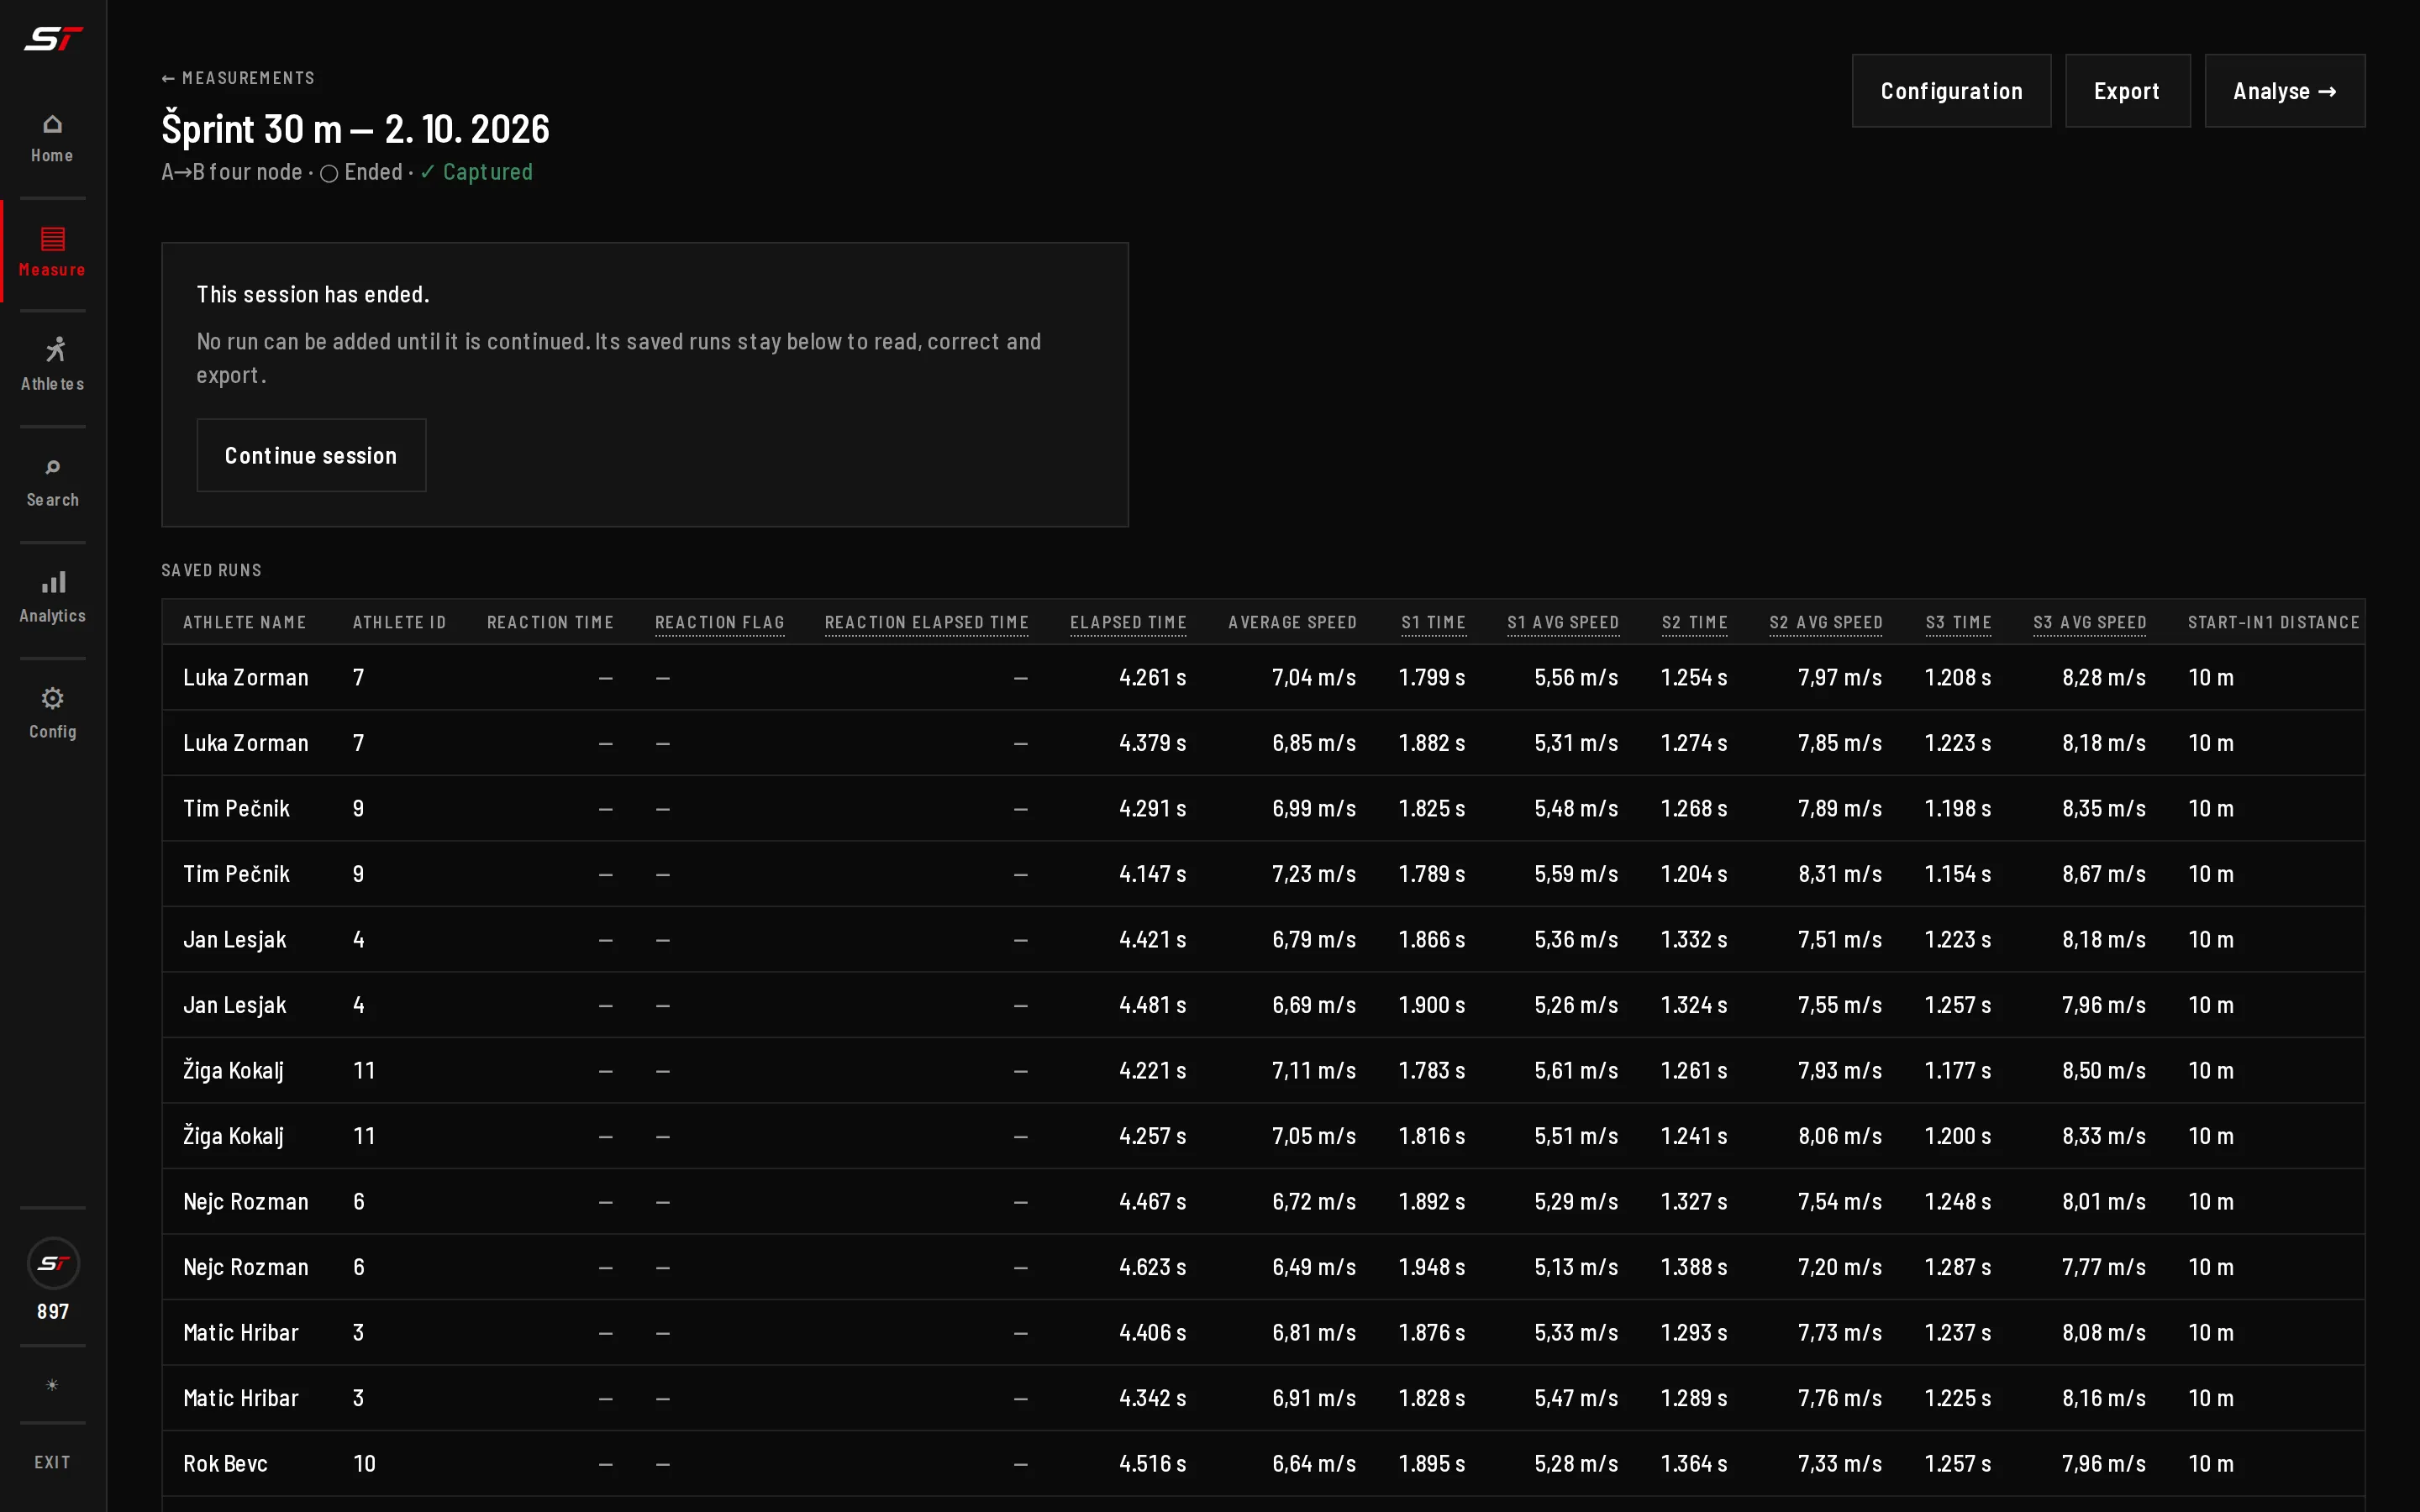
A 30 m sprint's results, with sector times and Export.
Search and labels
Simple search by an athlete's runs, by session or by session labels, for an easier overview of your data.
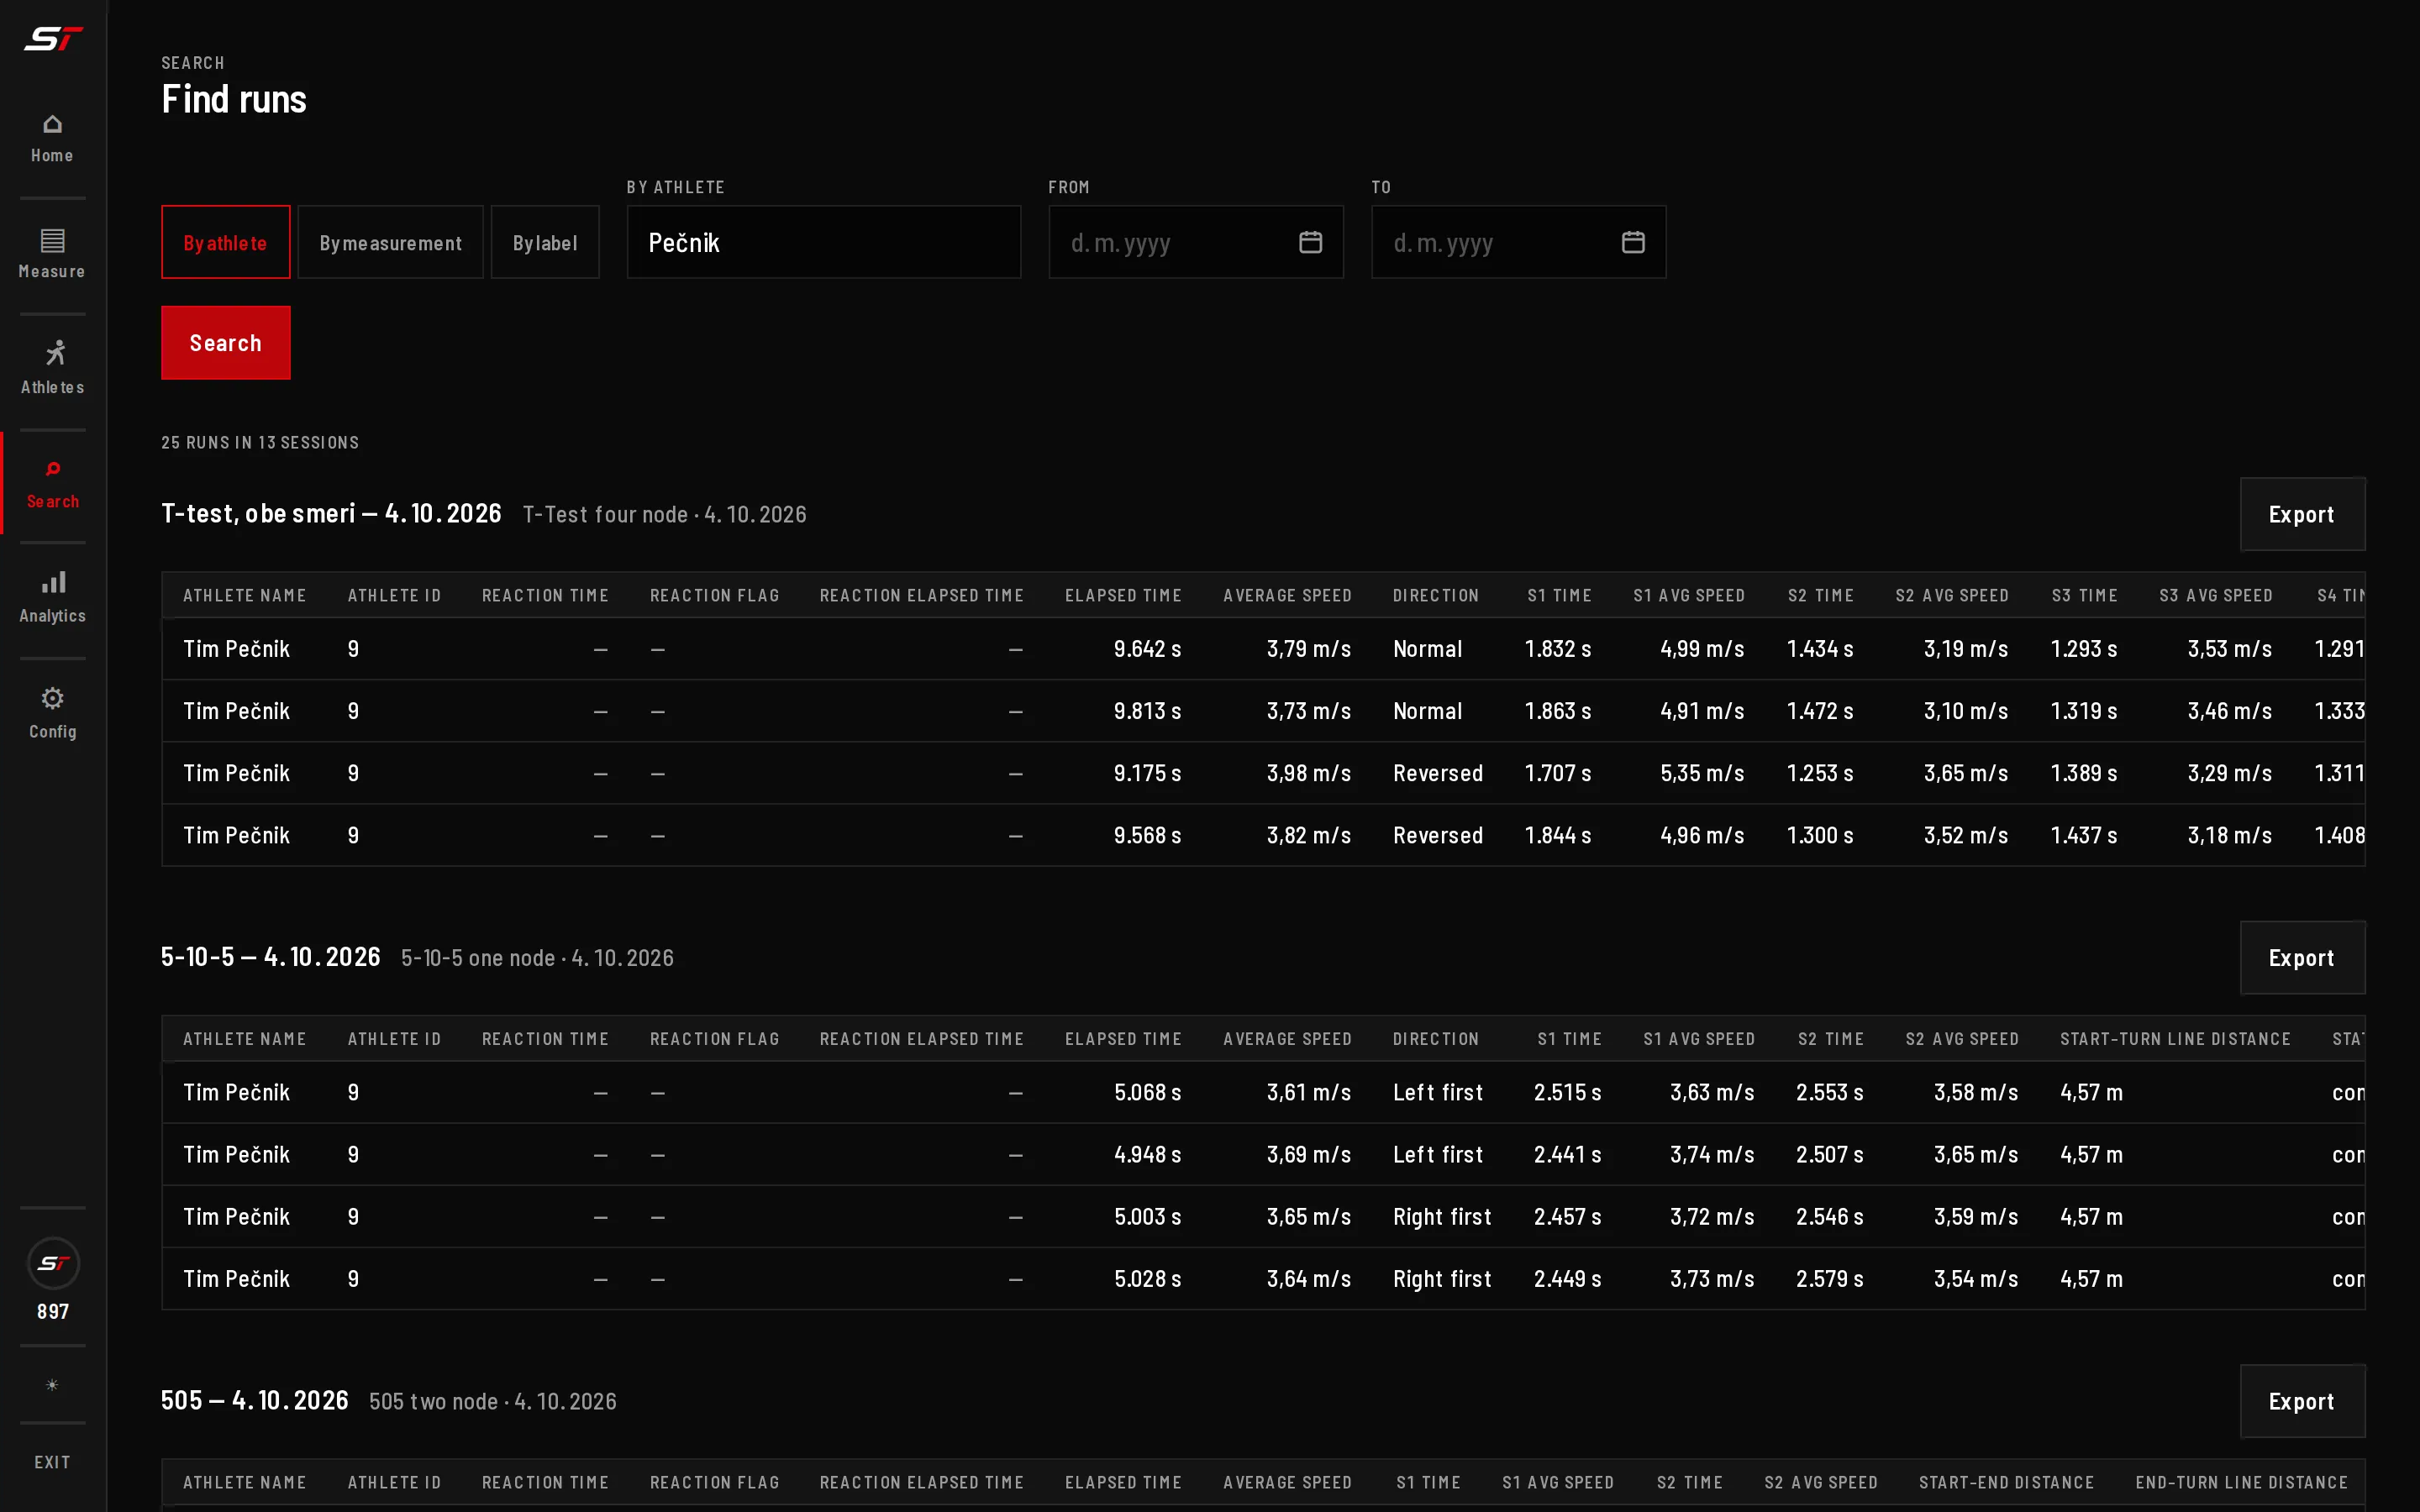
Searching by athlete: all of one athlete's runs, across tests and dates.
Impossible times
The app knows how fast a person can move: a physically impossible time is flagged automatically and not charged. The limits come from published, validated data, for elite or club level.
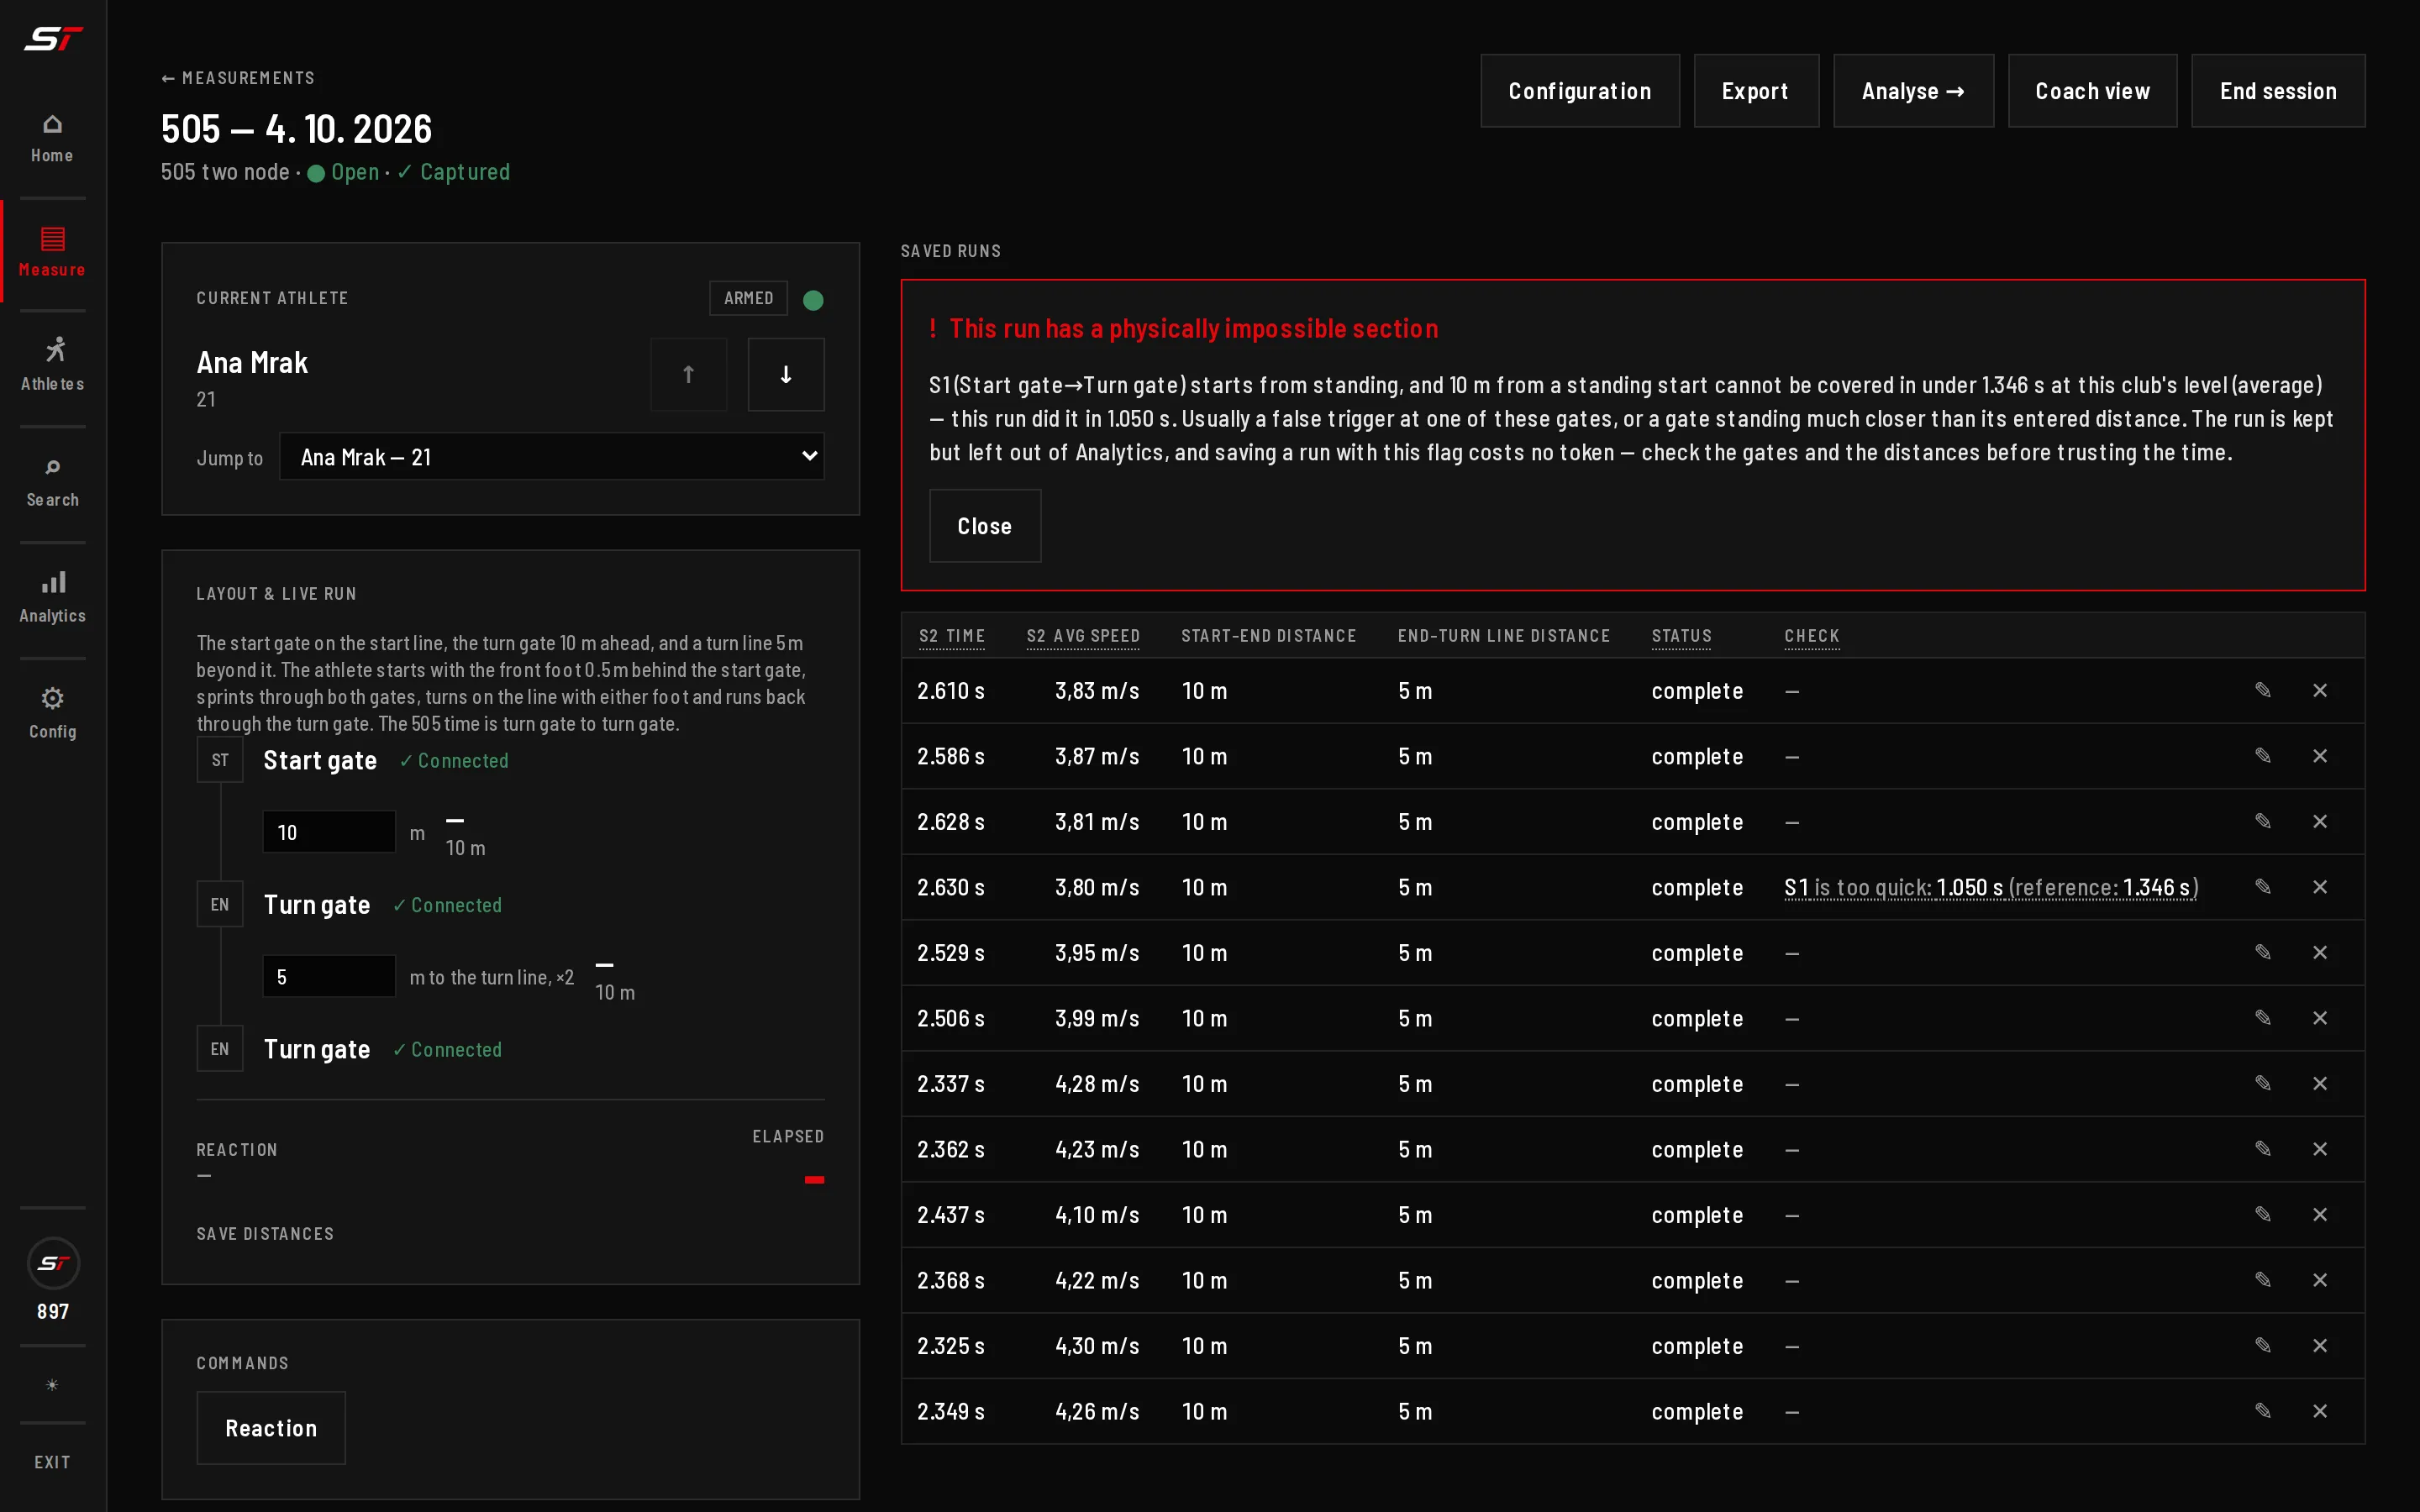
A physically impossible run, flagged and explained.
Coach view
The "Coach view" feature shows the last few measurements of the active session, so several people can follow it at the same time and see results as soon as they are in. No account login is needed to use it.
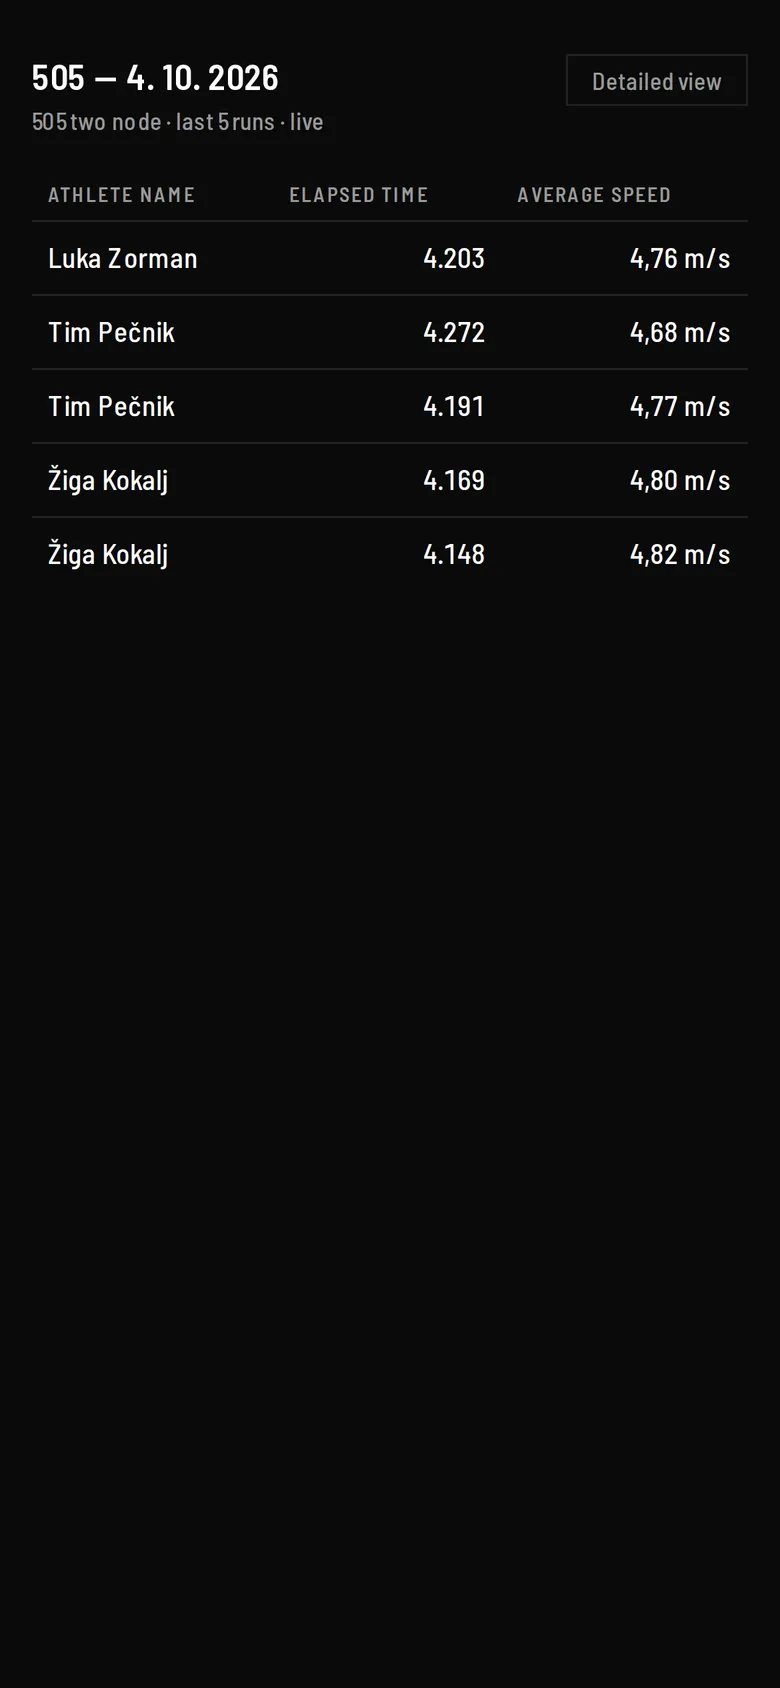
"Coach view" on a phone.
All screenshots show demo data.
Analytics — subscription
Extra features we make available to an organization as a subscription. Analysis of the measurements and a detailed look at what they say about the squad or an individual athlete.
Analytics for the whole session
The squad ranked from fastest down, the squad's spread around its median, each sector compared with the squad median, and the difference between directions in the T-test and 5-10-5.
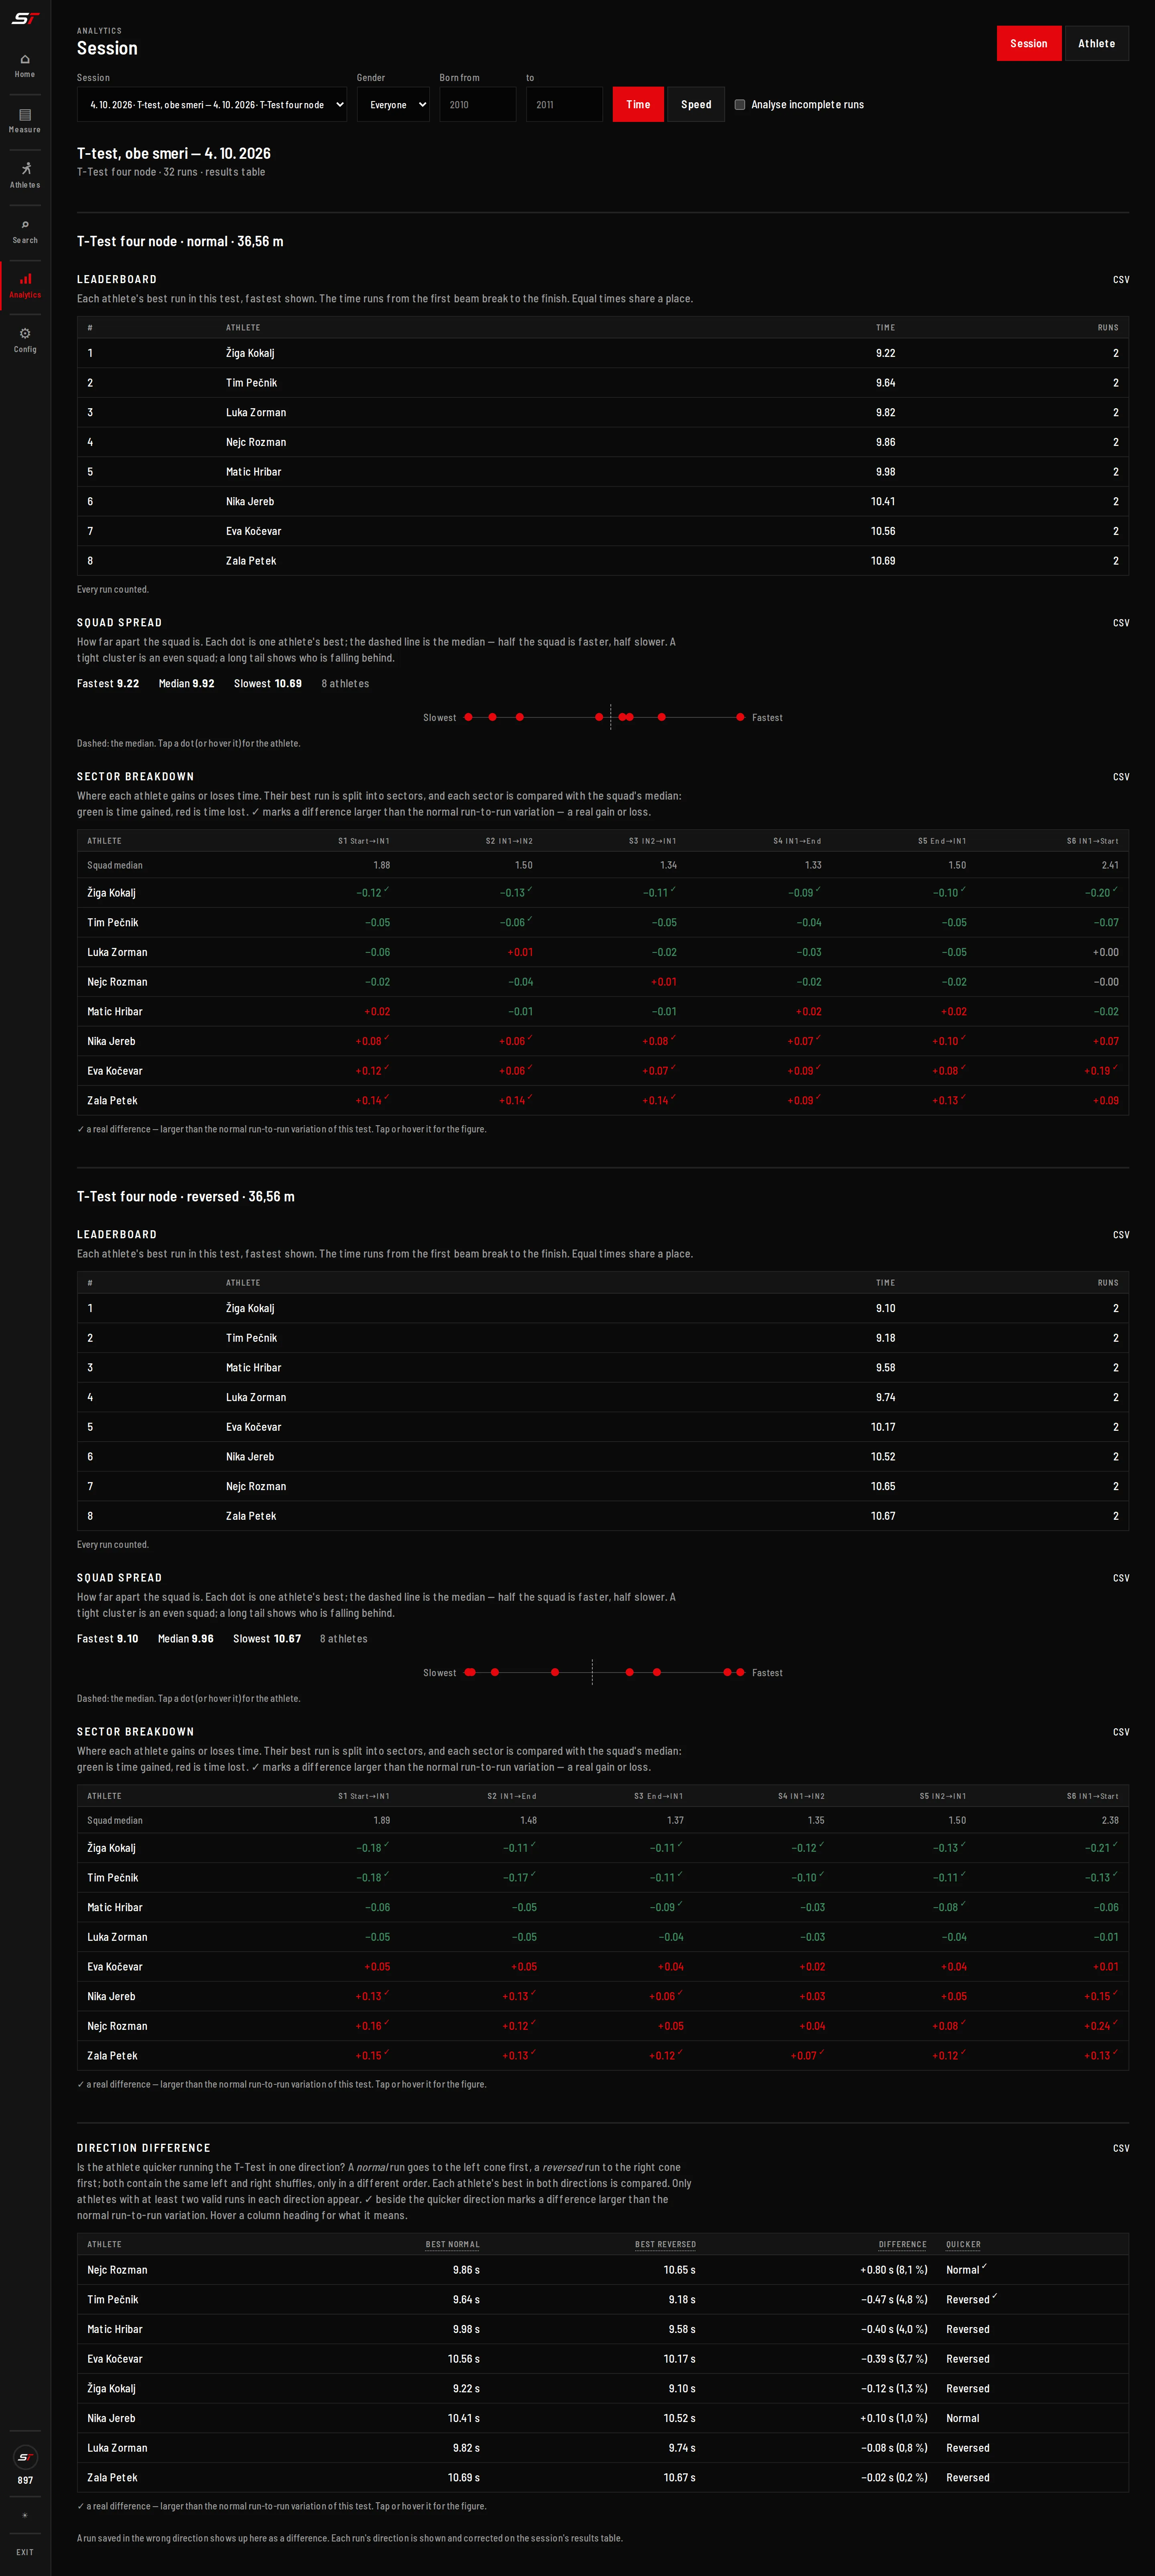
A T-test run both ways: leaderboard, spread and sectors for each direction, and the direction difference.
Analytics for the athlete
A detailed look at the current state, progress over time, comparison with the other athletes in the organization, and more. Shown for each athlete individually.
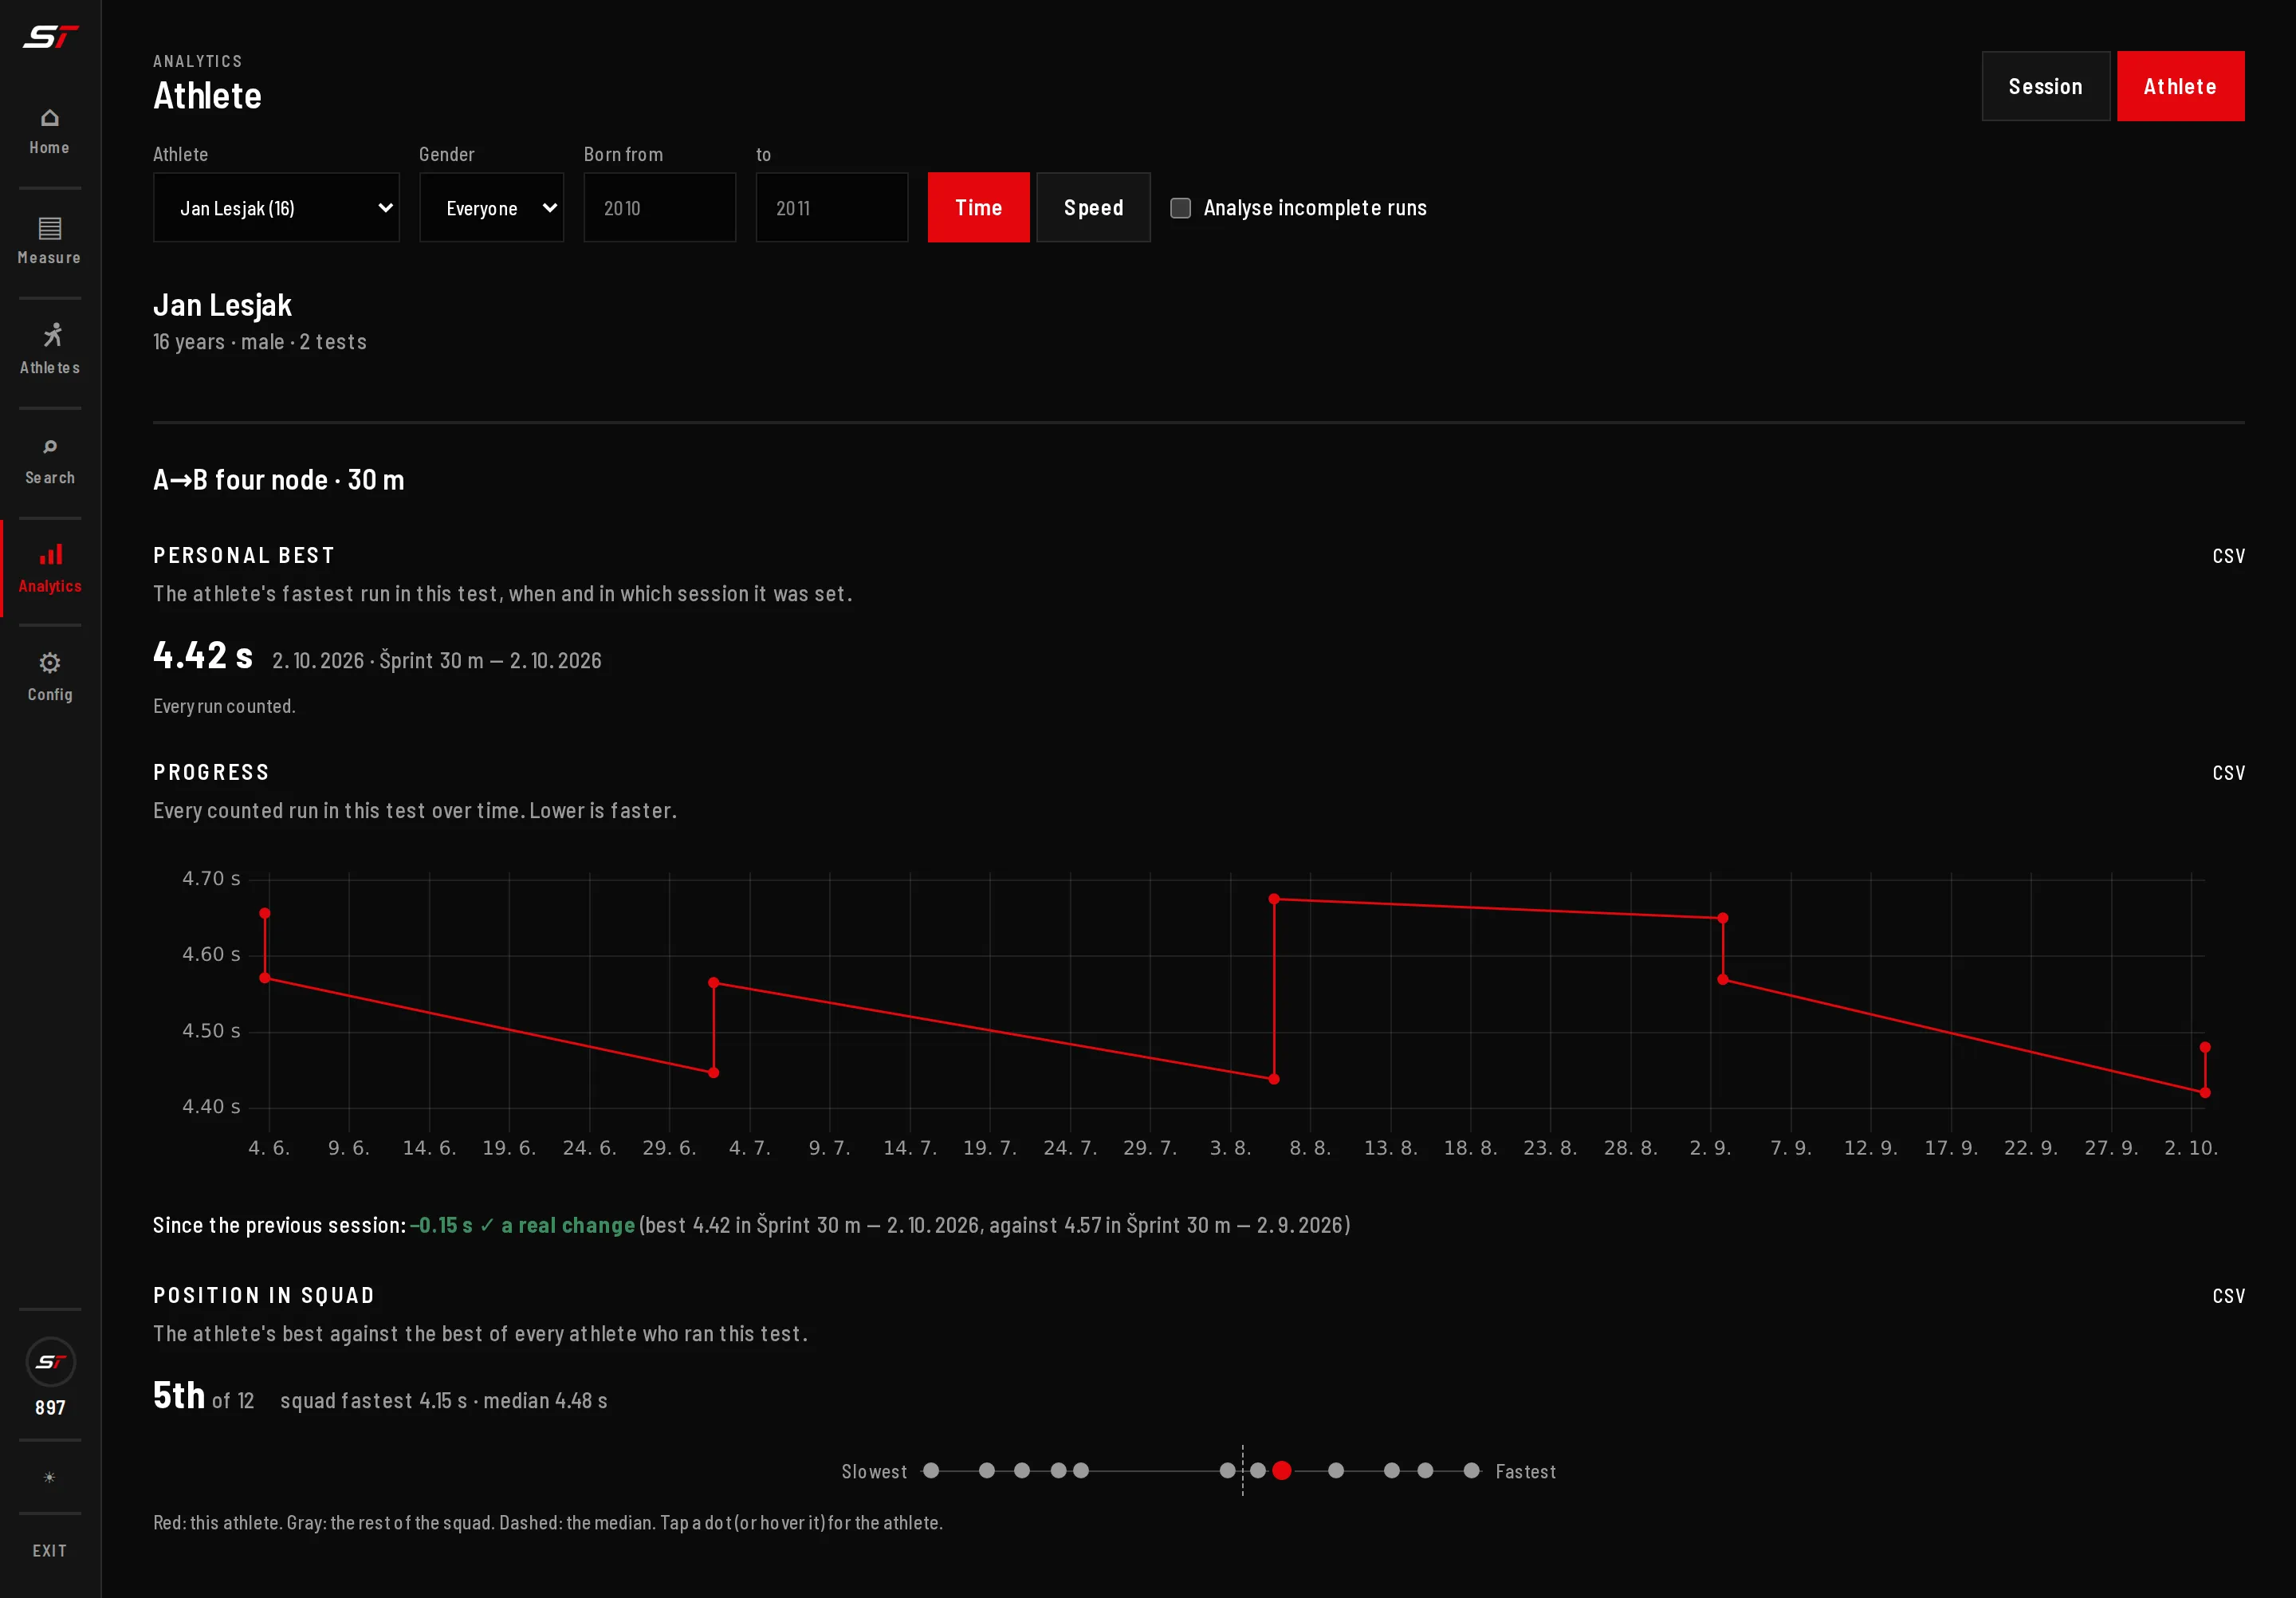
Athlete view: the personal best, progress over time and place in the squad’s spread.
Analytics validity
People aren't machines. Runs typically vary by 1–3 %, according to published research. The app calculates this variation automatically for every measurement and marks with a tick ✓ the analytics results where a difference is bigger than the variation. So you can tell whether the athlete has really improved, or whether it's just normal variation. Runs with a physically impossible time, which usually point to a fault in the equipment or the measuring process, are left out of the analytics automatically.
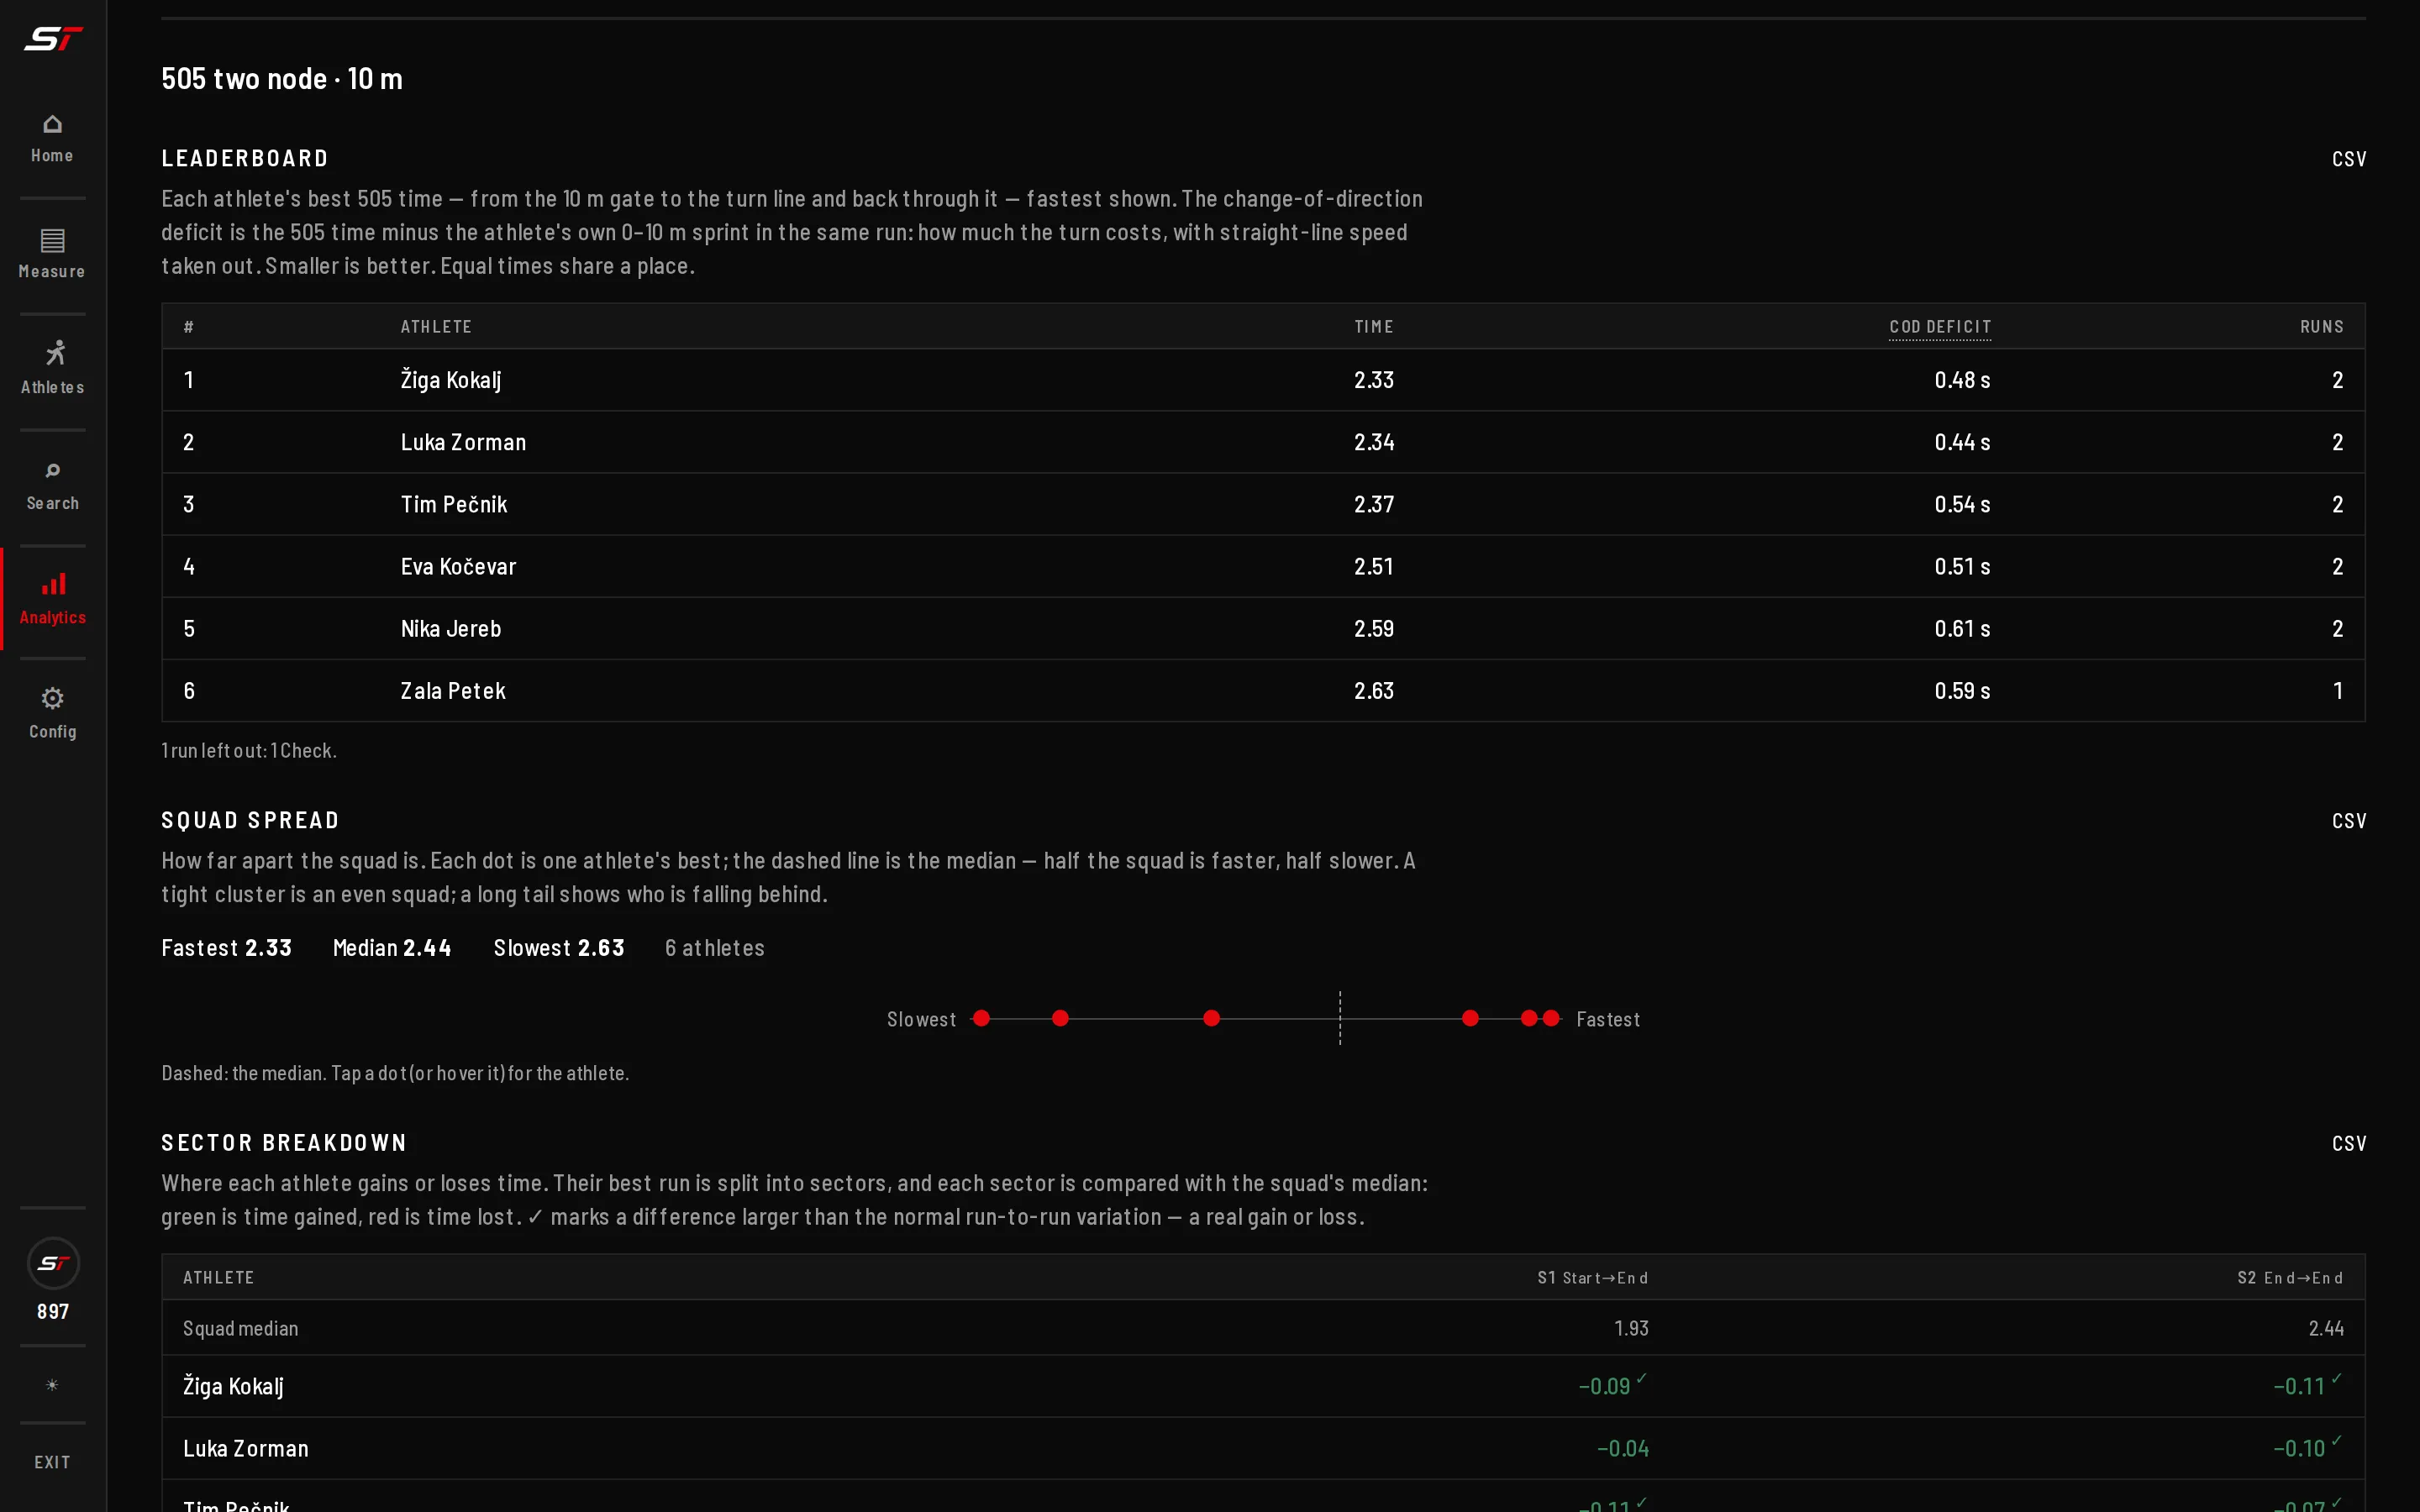
A 505 session view: the impossible run left out, a tick on the real differences.
Filters by gender and year of birth; every figure also exports as CSV.
All screenshots show demo data.